I feel PageRank and SimRank are very interesting algorithms after learning them. They are able to provide fascinating insights for connections in any area. This blog is one of my attempts of applying SimRank to find such connections, in research areas.
We all use Arxiv to post our research results. When I posted my first paper, there was a big question to me: How to choose the tags as areas of research? cs.LG (machine leanring), stat.ML (also machine learning), math.OC (optimiztion and control), cs.DC (distributed computing)? Fortunately, it is allowed to choose multiple tags, which enables us to make this project happen.
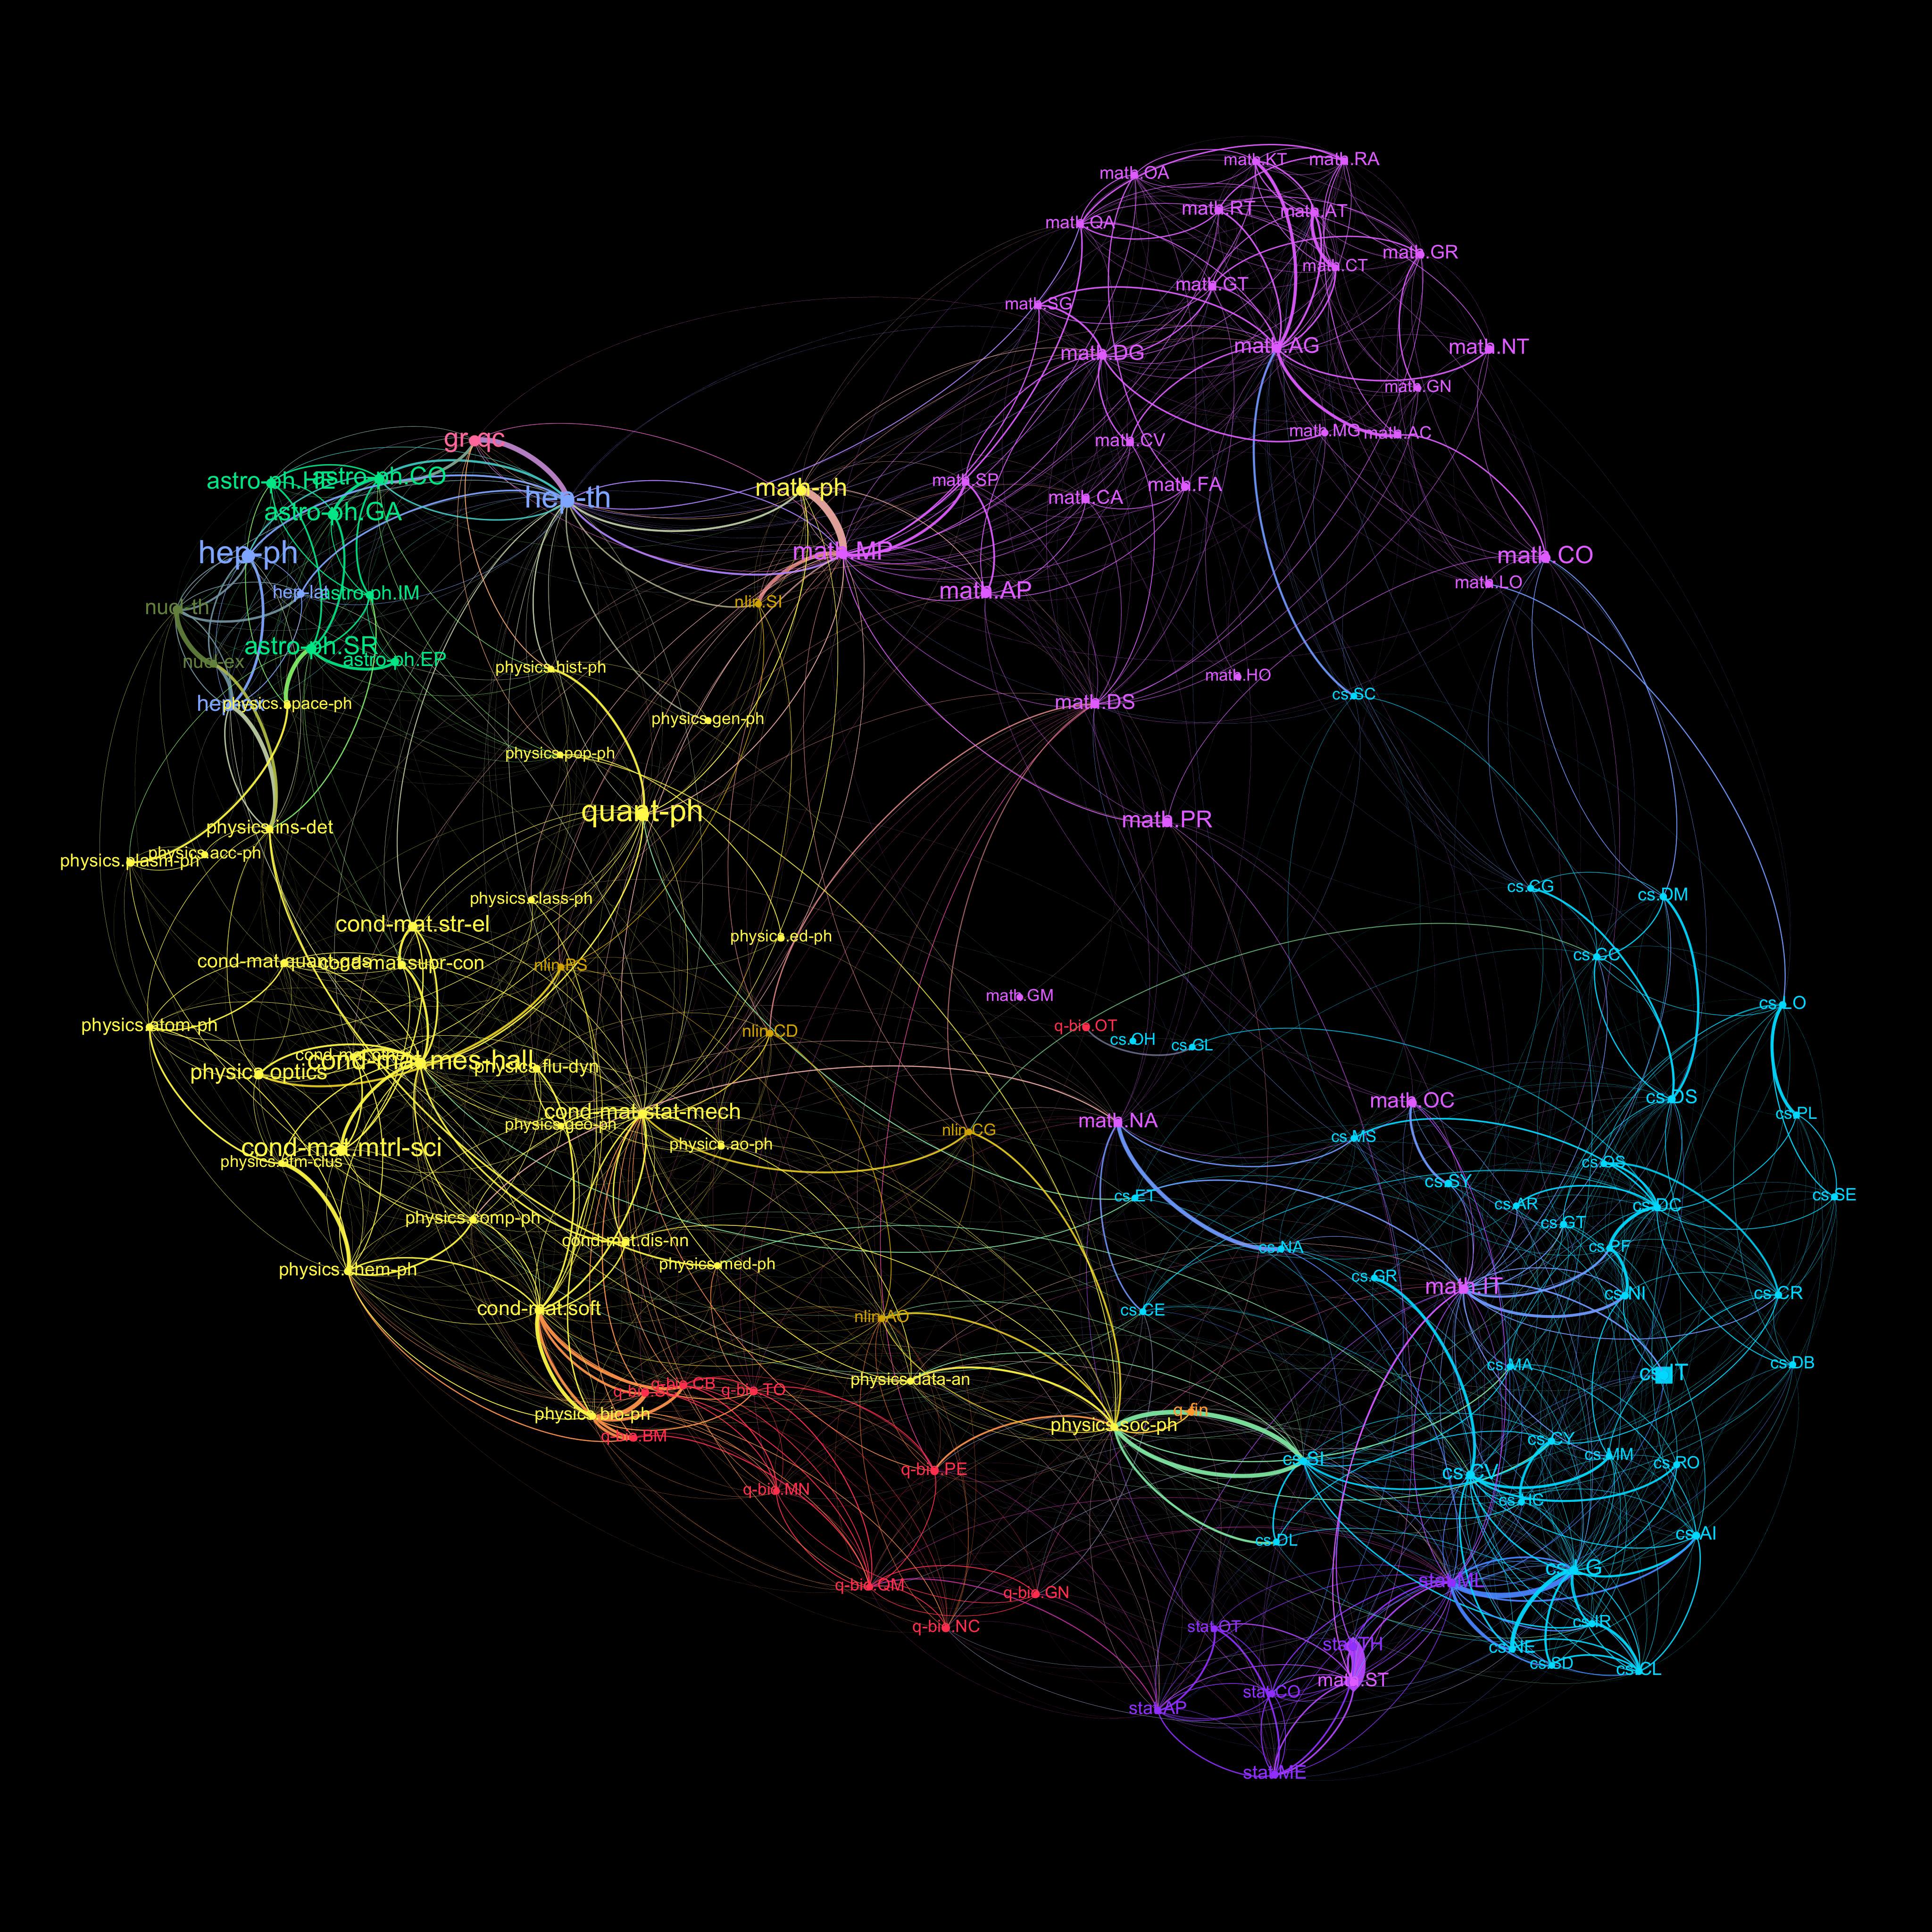
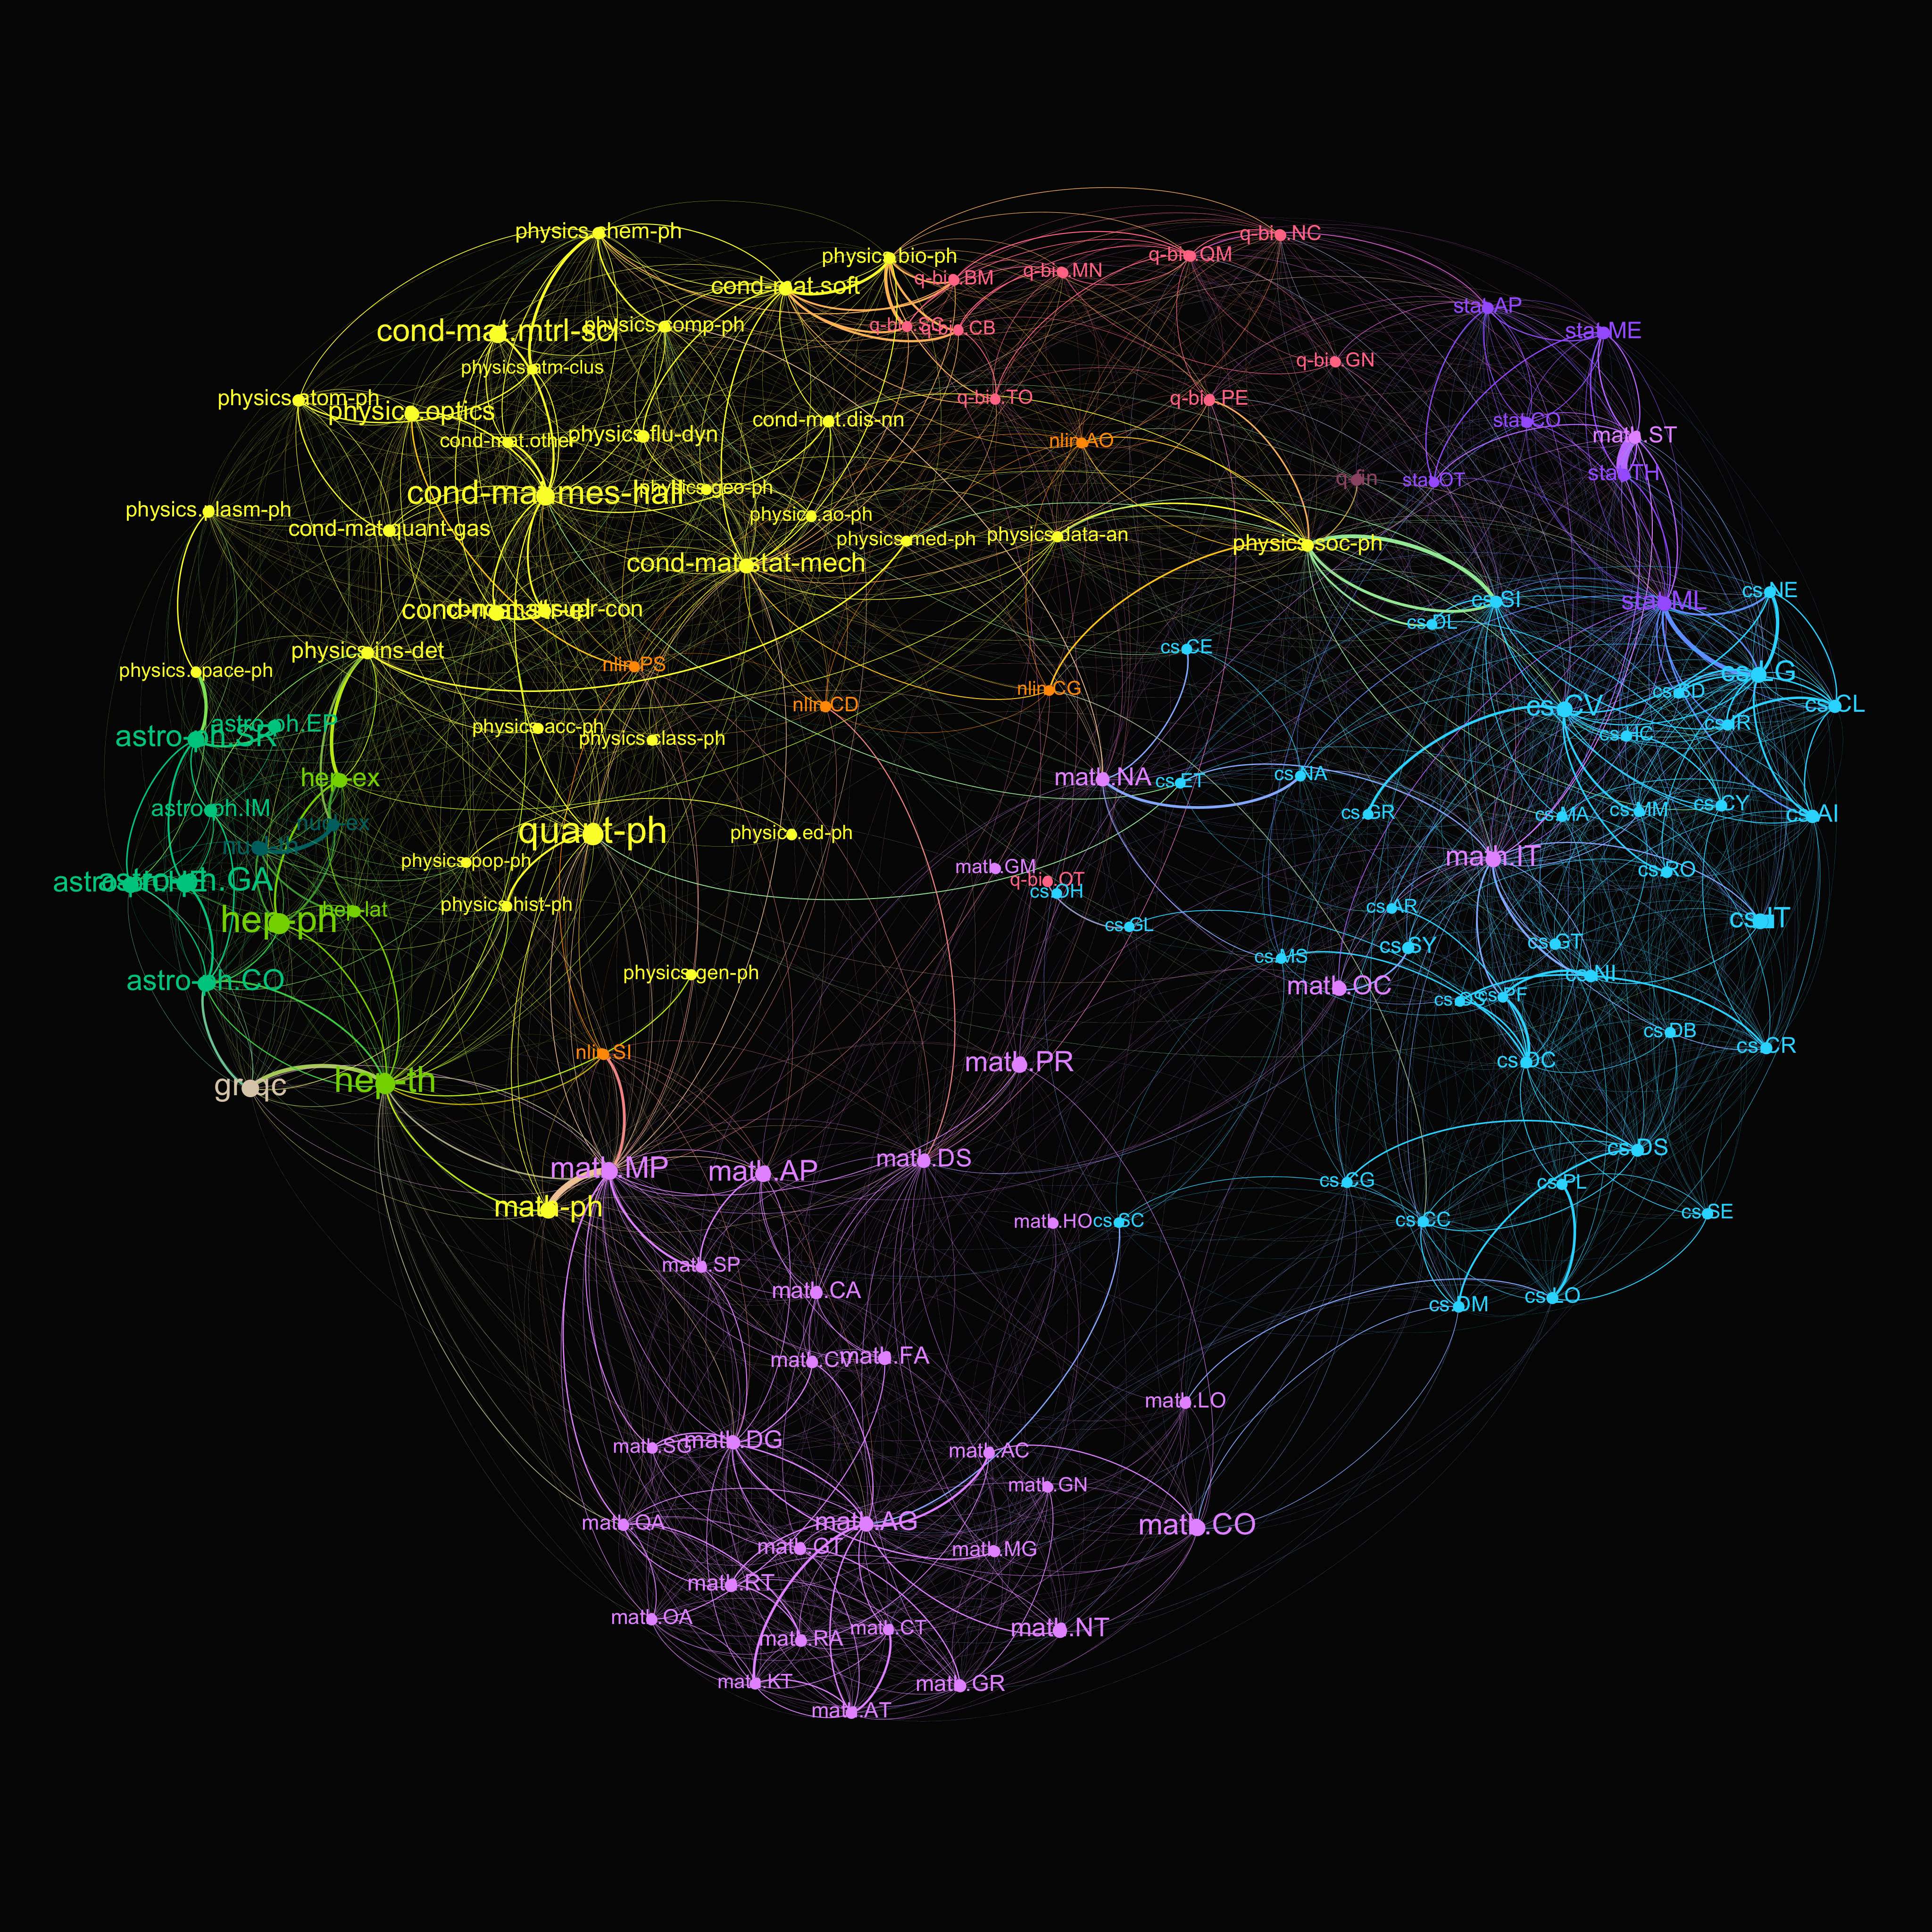
Let’s show some results first. There are two visualizations below. A same color of nodes and links means the same discipline, for example, math or stat. A thicker a link indicates a stronger connections between two research areas. There are many interesting findings, like Math and Statistics are weaker connected than I thought.
Connections of research areas for Arxiv papers in 2017
 Connections of research areas for Arxiv papers in 2018

What’s coming next is the procedure to make it happen.
-
Data. There is no public dataset for article titles and tags on Arxiv, which means I need to gather them by myself:) Finally I got around 27k article records, from which 19% articles have more than one tag.
-
One-hot encoding The next step is to transform text like tags and article titles into unique numbers. One-hot encoding is a simple and efficient way.
-
SimRank It’s the time to run SimRank now. Basically it means many iterations of sparse matrix-matrix multiplication. I implemented it in Apache Spark to avoid burnout of my laptop. The code is attached at the end.
-
Visualization The most important step is here. A lot of credits to Gephi, an amazing software to visualize graph data.
Thanks for reading!
import sys
from pyspark import SparkConf, SparkContext

import numpy as np
import scipy.sparse as sps
from pyspark.mllib.linalg import Vectors
from pyspark.mllib.linalg import SparseVector
from pyspark.mllib.regression import LabeledPoint
import csv

def parsePoint(line):
    line = line.split(',')
    label = int(line[0])
    linksTo = line[1:-1]

    NNZ = len(linksTo)
    index=[]
    values=[]
    for e in linksTo:
      index+=[int(e)]
      values+=[1/(NNZ+0.0)]


    return LabeledPoint(label,SparseVector(NNZ,sorted(index),values))

def doMultiplication(labeledPoint):
  out=[]

  label = labeledPoint.label
  sparseVector = labeledPoint.features

  if sparseVector.size > 0:
    ri = r[labeledPoint.label]
    value = ri*sparseVector.values[0]
    for rowId in sparseVector.indices:
       if rowId < totalPages:
         out+= [ [rowId,  value] ]

  return out


if __name__ == "__main__":
    conf = SparkConf()
    conf.setAppName("SimRank")
    sc = SparkContext(conf=conf)
    batchsize = int(sys.argv[1])
    index = int(sys.argv[2])

    linkData = sc.textFile('catgoNetwork.txt').map(parsePoint)

    totalPages = linkData.map(lambda a: a.label).reduce(max)
    totalPages = int(totalPages+1)
    print "Total catogories ", totalPages


    for starting in range(batchsize):
        r=np.zeros(totalPages)
        st= starting + index *batchsize
        print st
        r[st] = 1.0

        beta=0.8
        secondPart = r*(1-beta)
        linkData.cache()

        for it in xrange(10):
            #print "Iteration ",it
            newdata = linkData.flatMap(doMultiplication)
            reducedData = newdata.reduceByKey(lambda a,b: a+b).collect()
            r=np.zeros( totalPages )
            for k,v in reducedData:
                    r[k]=v*beta
            r = r + secondPart

        rOrig = r.copy()
        top = batchsize
        B = np.zeros(top, int)
        for i in xrange(top):
            idx = np.argmax(r)
            B[i]=idx;
            r[idx]=0

        name = 'edge'+str(index+1)+'.txt'
        edge = open(name, 'a')
        for i in xrange(top):
            if i==0:
                bm = rOrig[B[i]]
            if i>0 and B[i]<133:
                if rOrig[B[i]]> bm/300:
                    edge.write('%d,%d,%f\n' %(st, B[i], rOrig[B[i]]))
        edge.close()